This is my Eiffel Tower. This is my Rachmaninoff’s Third. My Pieta. It’s completely elegant. It’s bafflingly beautiful. And it’s capable of, well, math.
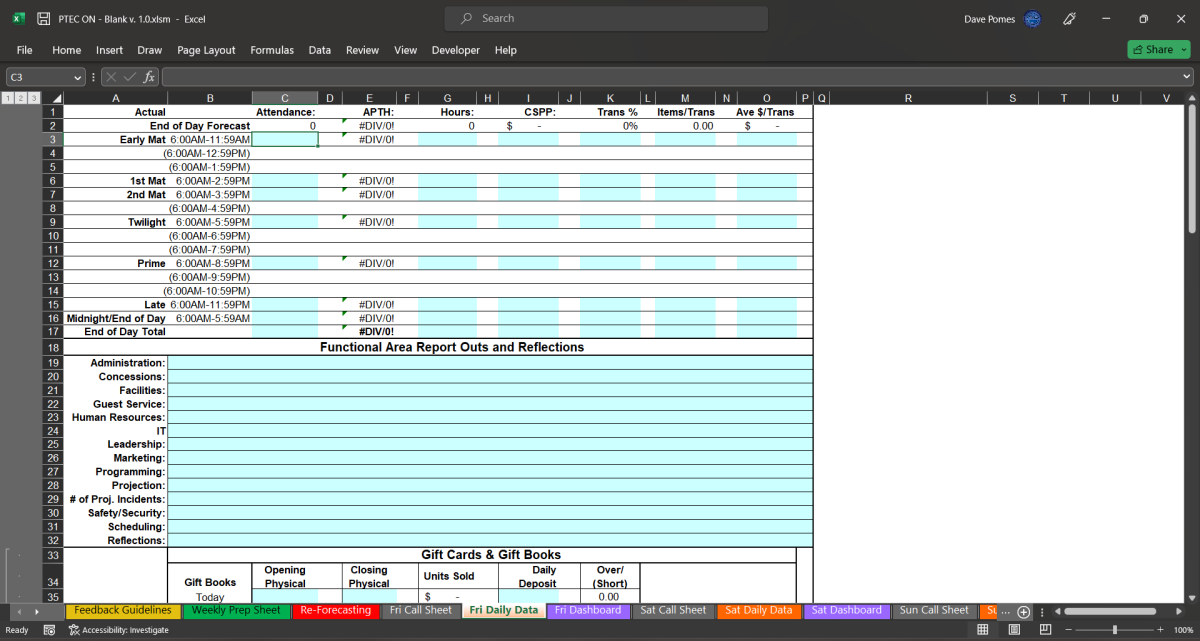
At Pacific we had a tool for generating attendance and gross estimates. We had a tool for payroll forecasting and staff schedule planning. We had a tool for projecting concession sales. We had a tool for reporting results and planning adjustments. The was no tool in existence for reforecasting staff hours once the week was underway.

Pacific was a small chain, maybe a dozen sites. The ArcLights were a separate company, operationally. Their systems were too special for Pacific’s crude tools of stone and Excel. But that also meant no one at the company really cared much about creating things for the Pacific chain. (And as with AMC, their recruiting had produced a workforce with few skills for the task anyway.) The whole handful of planning tools available combined with the lack of interest in building things meant that every week, those dozen sites were building out their weekly plans and executing on them in a dozen different ways.
What I saw was a need to combine all of those individual tools into a single process flow. Each week’s business cycle, from planning to after-action would be captured in a single place. Each site would be approaching the weekly cycle in the same way. Managers across sites could speak the same language about planning and results, and everyone could train towards the same outcome. It had to be flexible enough to incorporate different paths to the same result, it had to be usable for managers and staff alike, it had to produce analyses that were correct to budget, it had to be locked down so that it wouldn’t be broken by careless usage.
All of that was easy.
Inventing and integrating the payroll reforecasting element took close to five years.

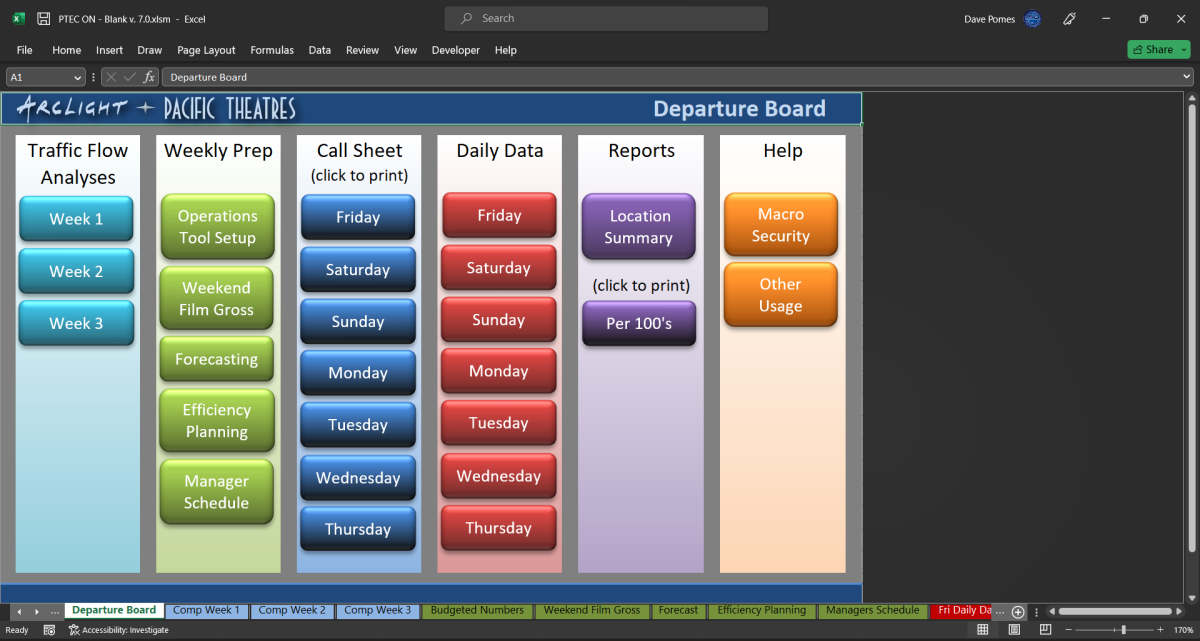
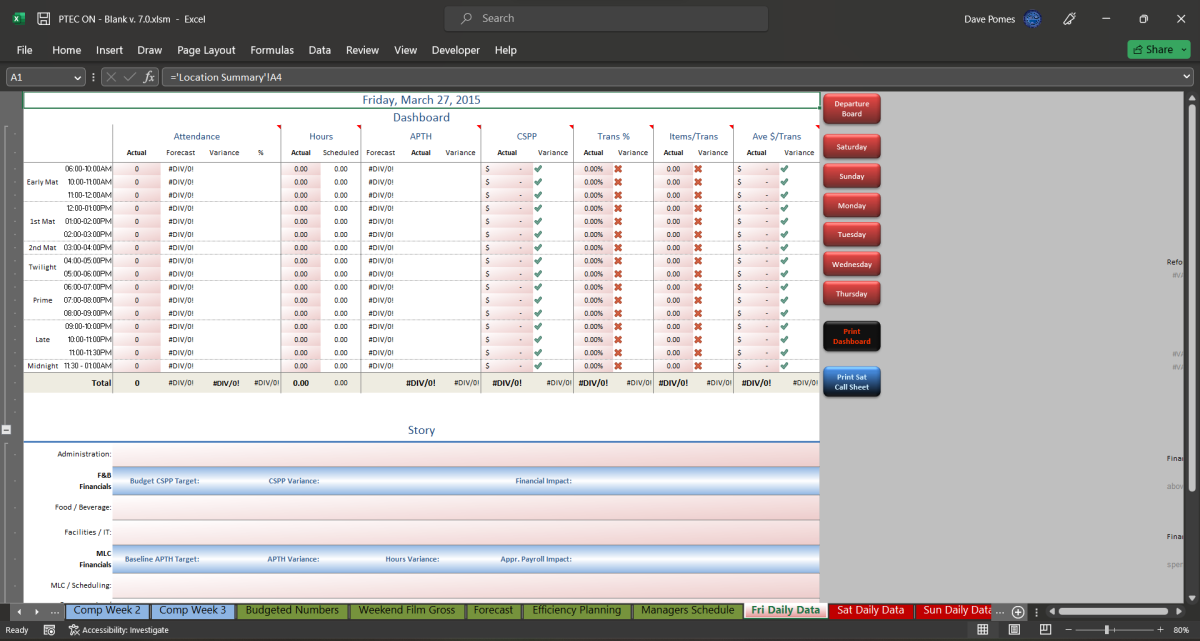
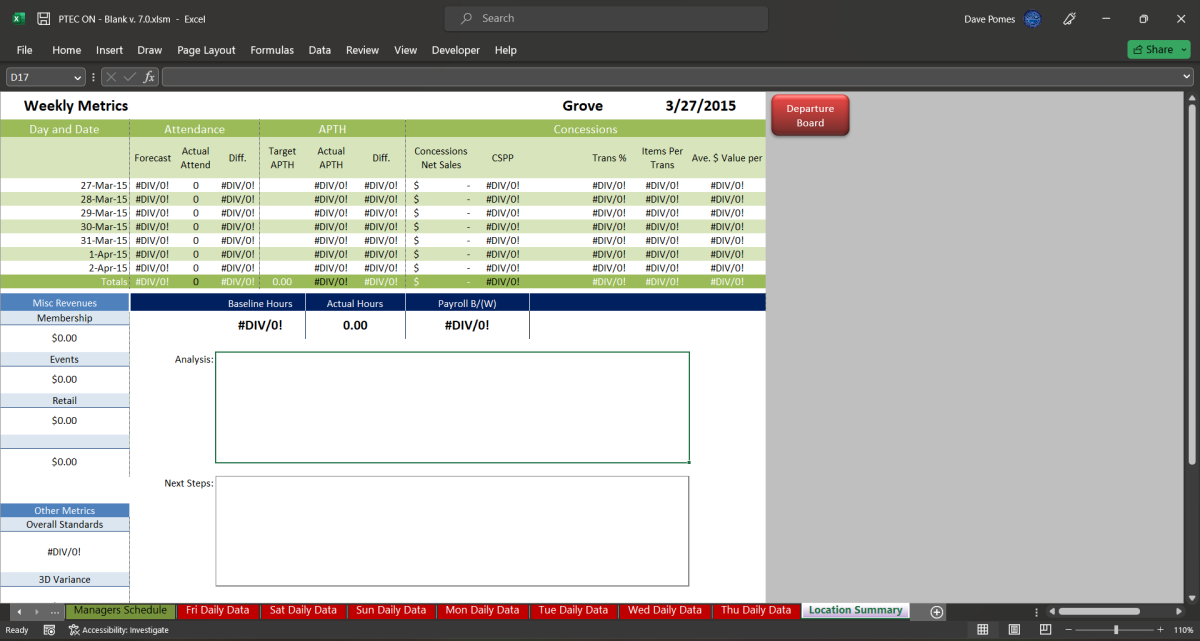
Early versions were rudimentary, and upgraded every few months as needs became clearer. By v3 I’d moved to an annual cycle. At the end of the year I’d solicit feedback from the circuit and build out that year’s upgrades. I took the tool to v7 before my time with Pacific ended. v1 was maybe a few sheets, v7 was a solid dozen plus multiple hidden pages and VB modules under the hood. Building v1 was assembling a puzzle, unifying the design was painting a picture. Each successive upgrade moved the complexity of the puzzle a little further and the purpose of the design a little clearer.
And there was of course the underlying reality that the tool that drove Pacific’s business cycle and unified its processes for 6 years was built, developed, and maintained by me. Not some team hiding out behind the scenes somewhere. My cells, my sheets, my code, coordinating millions of dollars in commerce every week, for years. Accurately, reliably, progressively. You want to talk about personal wins, that’s part of why these Notes rank so high on my personal list.


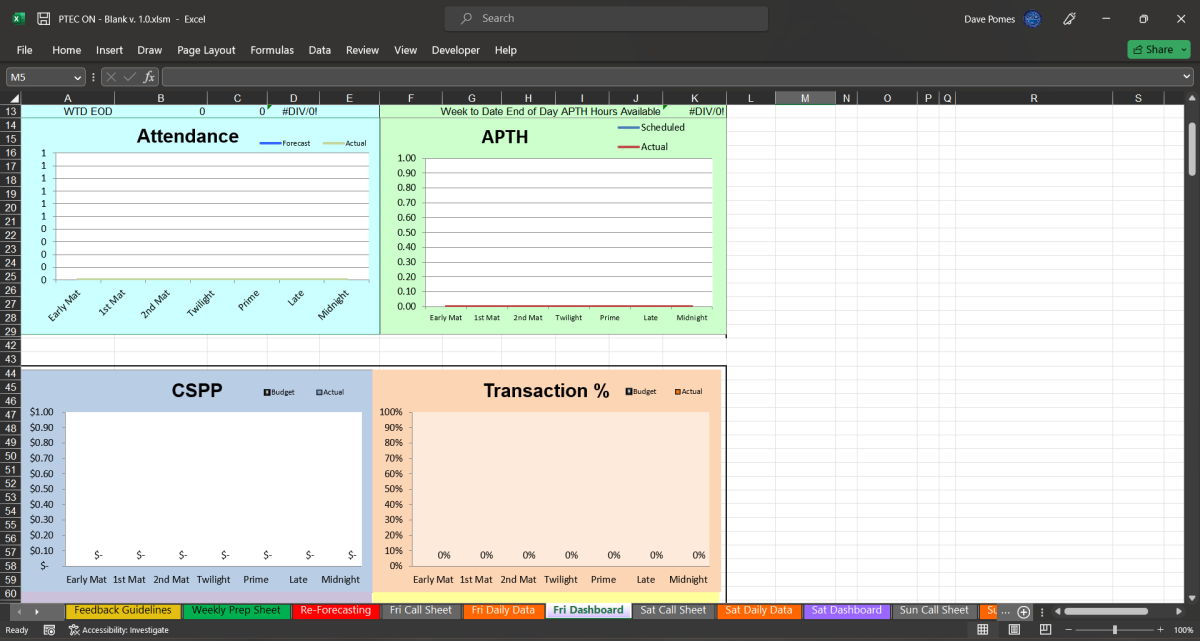
But the Notes are a double whammy for their payroll chops. Theatre payroll is tricky. Your budgeted payroll is proportional to your attendance, but the attendance you forecast for and the attendance that walks through the door are never gonna be the same (well, almost). When that attendance is different, your payroll needs to change in a hurry. Too slow and either you piss customers off or you dig yourself an even deeper payroll hole, while you’re figuring things out. And figuring it out is not easy. It’s not linear. If your attendance is down by 10%, your payroll may only need to go down by 8.5%, but even there from where do you cut? The same percentage every day or do you stagger it to better absorb the reduction, and stagger it by how much? What needs to happen between now and closing time in five hours to salvage the day’s payroll?
For my entire decade of management at AMC, these questions were all entirely up in the air, and at the discretion of whomever happened to be closing that day. We knew we were aiming for a moving target (payroll) with another moving target (attendance) and where those points were supposed to intersect. But how to – on a Friday night – look at your attendance at 830p and come up with a new plan for the rest of the week? Maybe 10% science, 90% user. And that was AMC, the company that otherwise made theater ops a science.
Building out the Notes for Pacific though got me closer to the roots of payroll planning- most importantly, the equations that governed the relationships between attendance and payroll targets. It was equivalent to unlocking an API; I could start playing with the behavior of those moving targets and begin incorporating planning tools by around v2. But the Holy Grail was the ability to go in at any point, plug in a difference factor, and get a set of directions for the rest of the day/week that would land you EXACTLY where you needed to be.


Which would be golden because then you had the room to tweak things and aim for specific improvements. Removing the uncertainty of “this is where we think we’re supposed to be” and standing on a solid payroll footing at all times, changes the nature of the plans you can make. You’re not trying to land reasonably close, you’re figuring out exactly how much you’re going to beat that moving target by.
But making that work? For the first few years the Notes were only dressing up manager legwork. By v6 it was time to get it done.
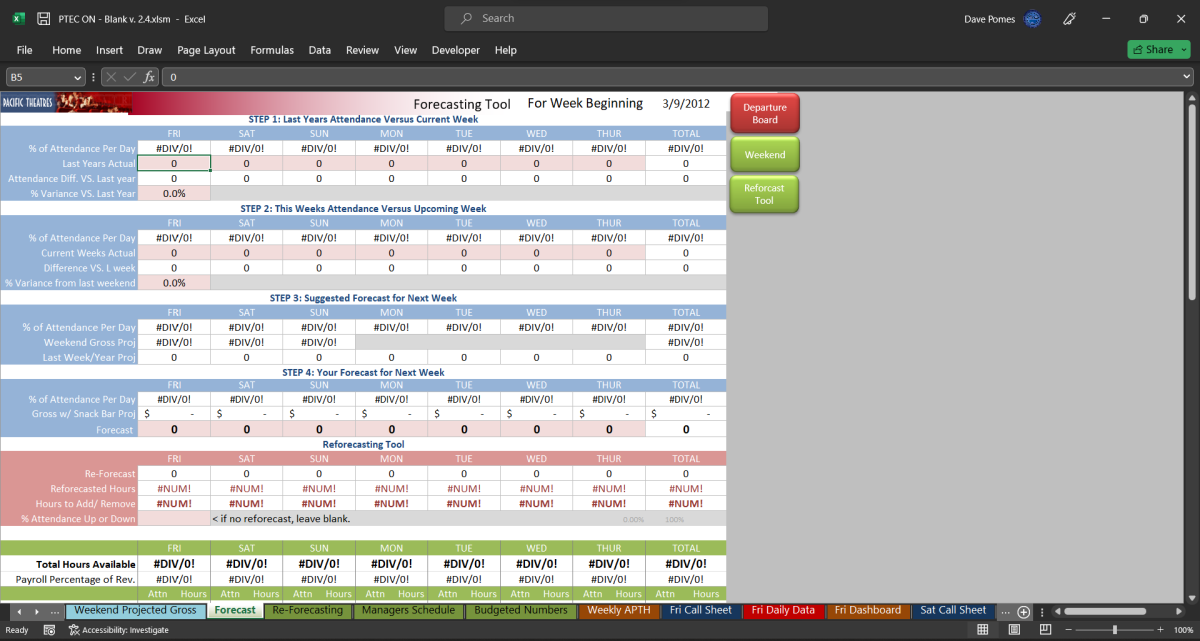
I remember it took almost two weeks, a few hours here, a few hours there. I had a solid idea of what terms I was working with and what I needed them to do, but arranging them to achieve the result mathematically was another thing. Then one afternoon I was covering ops at the Northridge site. This was a slow weekday, so I could work in the office for extended trains of thought. I was plugging in sample results, tweaking the reforecast equation, and finally the results started looking like what they were supposed to. I went back with some live results and checked against the original payroll equations, and the math checked out. After 9 years at AMC and 7 (at that point) with Pacific, I finally had the rock-solid connection between forecast, actual, and budget.
It all boiled down to a single magical equation, into which all the actual-this-far results are combined with scheduled hours and reforecasted attendance to produce a precisely and accurately reforecasted set of staff hours. You could, if you needed to at 830p on a Friday night, look at your attendance and come up with a new plan for the rest of the week that would be 10% user and 90% science. And then change it again at 4p Sunday afternoon and get direction that was just as solid. One equation, modified incrementally for when in the week the reforecast was being planned.
Not even kidding, when the numbers started to work I jumped up and did a little dance.

It would probably take me a week to go back in and reacquaint myself with how it all works, but I would spend that week impressed with myself.
As of v6, my Notes made the leap against gravity and expanded outward from Pacific to include the ArcLights. This was not something that happened, it was dogma that the ArcLights were inherently superior to anything the Pacifics could produce. But in all the years I was developing the Notes for Pacific, the ArcLights could come up with nothing to match. And operationally, organizationally, the ArcLights were getting outclassed by the Pacifics. My Notes gave us a solid and consistent foundation the ArcLights lacked. So after a while on the sidelines, I was asked to build the ArcLights into the tool, from Hollywood to the planned expansions.
And just like that, again my tools had a hand on the wheel at some of the busiest theatres in the entire country. Fixing for ArcLight Hollywood was a real feather in my cap- ArcLight hired for directability, not creativity. Very few people ever got to make any kind of meaningful individual contribution at the circuit level. The issues with manager skill that tended to bring down ArcLight ops, I could turn that around from the cheap seats and make sure their iffy managers were at least getting solid direction from their systems.
Like I said, I didn’t invent ALL of the individual elements, maybe half. Other early contributors were credited in the file properties. But their integration within a new whole, the execution of the design, the addition of the reforecasting tools and the volume of code, I’m comfortable with claiming the bulk of the credit. Everything v2 and onward was authored by me, and upkeep for the entire circuit was maintained by just me for those 6 years. I already know what v8’s big step would have been- continuing to incorporate the complexity of both circuits side-by-side and fixing that Efficiency page to reflect only the site in question. v7 left off with the ArcLight curves added in, but the four different models in use pushed seamless integration past my deadline. The highlighting that it does now of the applicable model was always an interim solution.
Yes, I’m still proud! You would be too.
About The Author
davetwsprocket
Dave didn't get the memo until, like, just now. He is capable with arranging words, but only just getting started at getting those words to actually do anything. He is motivated by a disrespect for authority, and towards finally doing what's right. He's good with people, but that's a learned skill- his natural inclination is to be far, far away. He's a Leo. Active here and BlueSky, tilting on Instagram & X.